
Experiment
Backlog Visualization Experiments
Forecasts without estimation rituals: waterlines, statistical ranges and trends drawn from what the organization actually delivers.
In brief
The problem sits at the interface between units working in an agile way and an environment tied to milestones.
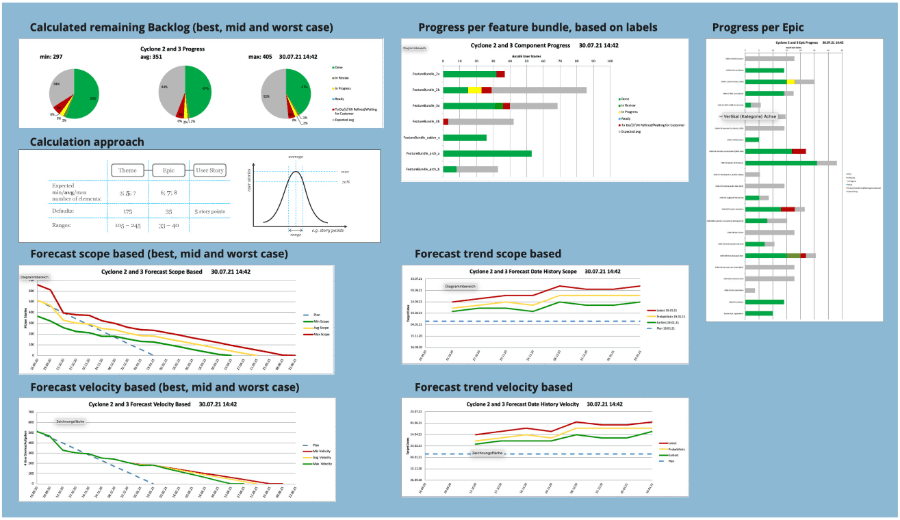
Rather than simulating the future, the current state of the backlog is made visible as a trend on three levels, with ranges for the worst, best and probable case.
The purpose is not a status report but a question to the organization: should or must we change our behavior?
Presented at the LeSS Conference 2023 in Berlin together with Frank Preiß, BMW.
Motivation
One of the biggest challenges when introducing agile ways of working or LeSS in large-scale product development is dealing with the interfaces between the unit introducing agile/LeSS and the surrounding departments, which are tied to milestones in a waterfall-style organization.
This is the case, for example, if you introduce Scrum, LeSS or another agile way of working in a smaller part of your organization or only in a sub-project. In this case, the product owner often has to enter into agreements or even commitments with specific delivery dates with partners.
One possibility is to estimate the effort for all elements in the backlog and measure the velocity of the teams. In this way, the Product Owner could predict when a bundle of tasks related to an agreed milestone will be completed. However, this is highly speculative and defeats any agile approach by introducing an analysis and design phase before the development phase. This is a sequential lifecycle, a waterfall process.
Rather than simulating the future, I make the trend of what the organization actually does visible.
I have been experimenting for more than ten years to solve this problem and to minimize the negative effects. In contrast to the approach of predicting the future with the help of a Monte Carlo simulation, I use a trend-based visualization of the product backlog. This initially increases transparency by showing current progress at the overall level and at three backlog levels.
Combined with a statistical approach (standard deviation and queueing theory), forecasts can be made for the worst case, the best case and the probable case. This approach therefore gives an indication of what the future would look like if the organization maintains its behavior.
The actual purpose
Should or must we change our behavior?
The aim is to make the organization think. It is therefore not just about producing a report. Rather, it is about reflecting on and adapting the behavior of an organization over time.
With this approach, some of my clients are able to determine very quickly and without team estimates how much effort, time or money a new backlog item (theme, feature or user story) or a release cycle will require.
From practice
At the LeSS Conference 2023 in Berlin, Frank Preiß (Domain Agile Master at BMW) and I presented this approach and shared our experiences from practice.
Impact in the BMW case GTA, Generic Part Aftersales
Main benefits
- Significantly decreased time to market
- All teams aligned to reach business goal
- In time, in budget, superior quality
Flow Efficiency
100 % would mean no waiting time at all during the development process. The figures show how strongly size and dependencies govern the flow.
- Value Stream GTA 87.90 %
- Domain Average 69.63 %
- Many dependencies 63.93 %
From the talk with Frank Preiß, Münchner Projektmanagement Tage, 20 November 2024.
 Flow efficiency by product size and dependencies
Topics
- Product Backlog
- Forecasting
- LeSS
- Agile Reporting
Material
Forecasts without estimation rituals?
If you sit at such an interface, write and tell me what has to be committed to on your side.
Read on